Xcode Frame Debugger integration
The Unity Editor integrates with the Xcode frame debugger for detailed frame inspection and debugging.
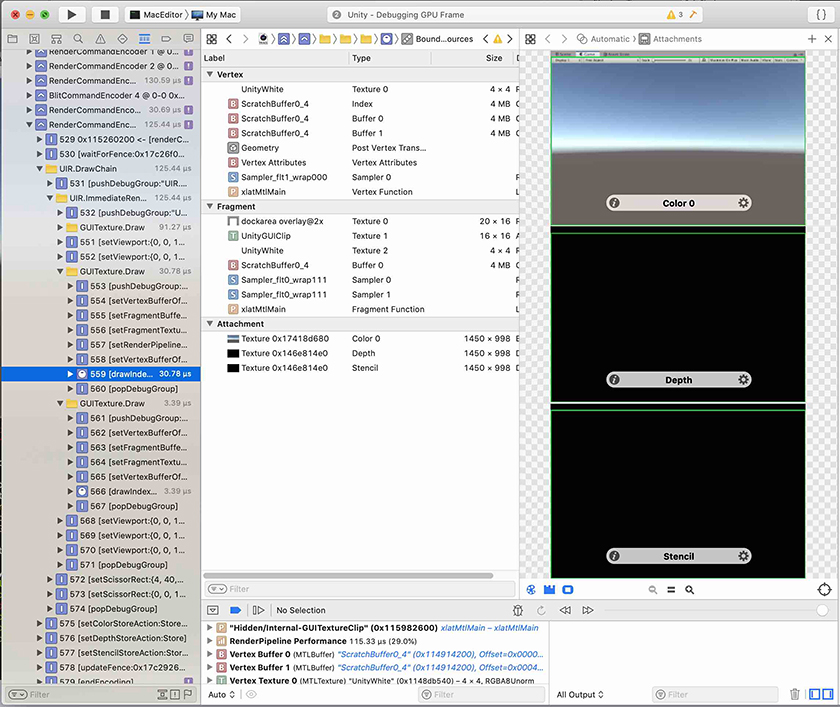
You can use the Xcode frame debugger to capture a frame of a complex sceneA Scene contains the environments and menus of your game. Think of each unique Scene file as a unique level. In each Scene, you place your environments, obstacles, and decorations, essentially designing and building your game in pieces. More info
See in Glossary in your application, then identify bottlenecks in your shadersA small script that contains the mathematical calculations and algorithms for calculating the Color of each pixel rendered, based on the lighting input and the Material configuration. More info
See in Glossary. On devices with the A11 chip or later (iPhone 8 and newer devices), Xcode offers an even more detailed breakdown of shader timing. This allows you to analyze performance and debug vertex and fragment issues.
Note: Frame capture with Xcode and Unity only works if Unity is running on a platform and graphics API that Xcode supports. As of Unity 2019.2, Xcode supports only macOS with Metal graphics. If Unity uses another API, the Xcode integration is disabled until you select a supported graphics API.
Loading the Xcode frame debugger
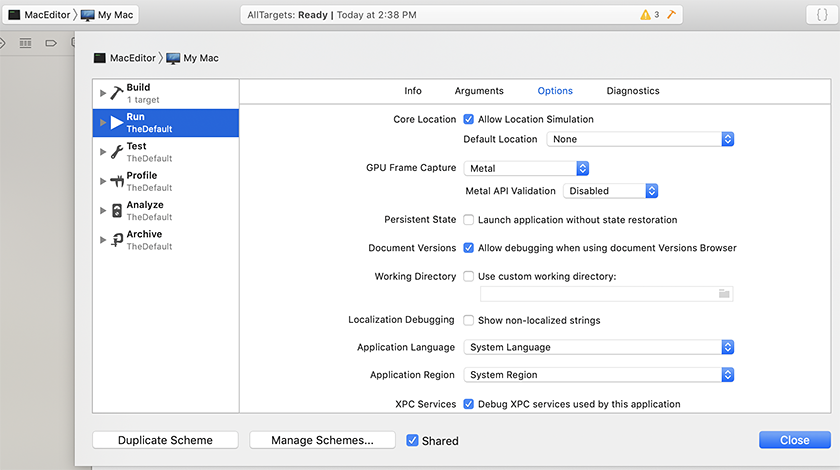
To load the Xcode frame debugger, launch the Unity Editor through Xcode, with Metal selected as the GPU Frame Capture option.

Capturing a frame with Xcode
When you launch the Editor from Xcode, a new button appears on the right side of the toolbarA row of buttons and basic controls at the top of the Unity Editor that allows you to interact with the Editor in various ways (e.g. scaling, translation). More info
See in Glossary in the Game and Scene views.

Select the Xcode Capture button to trigger a capture of the next frame of renderingThe process of drawing graphics to the screen (or to a render texture). By default, the main camera in Unity renders its view to the screen. More info
See in Glossary for the view. If Xcode isn’t open, when you select this button, Xcode launches a new instance to show the capture. Otherwise, the newest capture automatically appears in the Xcode frame debugger window. From there, you can open the capture and analyze it.

Did you find this page useful? Please give it a rating: