UI Profiler
The UI(User Interface) Allows a user to interact with your application. More info
See in Glossary Profiler is a profilerA window that helps you to optimize your game. It shows how much time is spent in the various areas of your game. For example, it can report the percentage of time spent rendering, animating or in your game logic. More info
See in Glossary module that provides information on in-game UI.
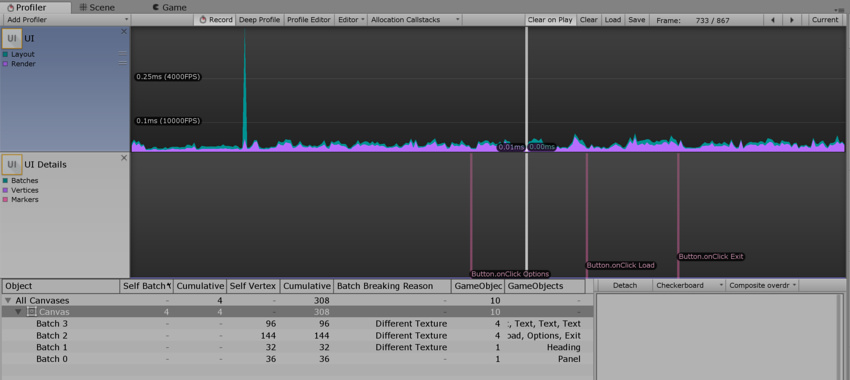
To access it open the Profiler window and go to Add Profiler > UI and UI Details.

Use this feature to understand how Unity handles UI batching for your application, including why and how objects are batched. You can also use the profiler to find out which part of the UI is responsible for slow performance, or to preview the UI (or part of it) while scrubbing the timelineGeneric term within Unity that refers to all features, windows, editors, and components related to creating, modifying, or reusing cut-scenes, cinematics, and game-play sequences. More info
See in Glossary.
Note that the Profiler is resource intensive and might create a performance overhead.
Settings
The UI Details chart has a Markers group that you can toggle on and off, similar to the CPU Profiler. The preview panel has a Detach button and two drop-down menus.
The Markers toggle displays or hide event markers on the UI details chart.
Detach pops the preview out in a separate window.
The two drop-down menus allow you to choose the preview background (black, white, or checkerboard) and the preview type (original render, overdraw, or composite overdraw).
Helpful Notes
Markers can be overwhelming, depending on the usecase profiled. Hiding or showing them when needed helps the chart readability.
To make visibility clearer, you can select the preview background according to the UI you are previewing. A white-ish UI on a white background won’t be readable, for example, so you can change it.
Detaching the preview allows better screen estate management.
Overdraw and composite overdraw are used to determine which parts of the UI are drawn for nothing.
Definitions
Marker: Unity records markers when the user interacts with the UI (for example, a button click, or a slider value change) and then draws them as vertical lines and labels on the chart.
Batch: the UI system batches draw calls where possible.
There are many reasons that Unity might be unable to batch objects together:
Not Coplanar With Canvas: The batching needs the object’s rect transform to be coplanar (unrotated) with the canvas.
CanvasInjectionIndex: A CanvasGroup component is present and forces a new batch, ie. when displaying the drop down list of a combo box on top of the rest.
Different Material Instance, Rect clipping, Texture, A8TextureUsage: Only objects with identical materials, masking, textures, texture alpha channel usage can be batched together.
Tips
Treeview rows have a context menu with a “find matching object in sceneA Scene contains the environments and menus of your game. Think of each unique Scene file as a unique level. In each Scene, you place your environments, obstacles, and decorations, essentially designing and building your game in pieces. More info
See in Glossary” entry, which you can also trigger by double clicking on a row.
2017–05–17 Page published
New feature in Unity 2017.1 NewIn20171
Did you find this page useful? Please give it a rating: